Change Detection Study of Abuja Municipal Area Council Abuja, Federal Capital Territory Nigeria between 2002 and 2023
Izuegbu Ogochukwu Uju1,2, Dalhatu Umaru Sangari2, Sunday Yusuf Kpalo2
Change detection is the process of identifying differences in the state of a feature or phenomenon by observing it at different times (Singh, 1989). In the course of urban development, changes have significantly occurred in the study area. This study was conducted in order to determine the land use and land cover changes (as well as the type of changes and their direction) occurring in the use of land in the Abuja Municipal Area Council, Abuja Federal Capital Territory for the period 2002-2023. Remote Sensing (RS) and Geographic Information System (GIS) techniques were used for the detailed derivation of the land use and land cover classes and the changes that occurred between them. Landsat satellite imageries; Enhanced Thematic mapper plus (ETM+) of 2002 and Operational Land Imager (OLI) and Thermal Infrared Sensor (TIRS) of 2023 were used to carry out supervised image classification using maximum likelihood algorithm in Erdas Imagine software environment. The Imagery used covered a span of 21 years. The classification results were used to carry out the change detection analysis using change detection work flow algorithm in ENVI 5.0 software environment. The results shows that the area where no changed occurred accounted for 27.031% of total area changes of the Land Use Land Cover classes, from built-up area to vegetation accounted 0.05%, from built-up area to bare land accounted for 0.56 %, from waterbody area to built-up area accounted for 0.03 %, from vegetation area to built-up area accounted for 28.3%, from vegetation area to bare land area accounted for 3.67 %, from bare land area to built-up area accounted for 38.93% and the area of change from bare land area to vegetation accounted for 1.39%. Change Detection Studies are crucial for understanding environmental changes and making informed decisions, successful planning and urban management.
Keywords— Remote Sensing, Geographic Information System (GIS), Land Use Land Cover, Change Detection, Urban Development
Change Detection (CD) in Remote Sensing is the process of identifying changes in a scene by comparing two images of the same area taken at different times. It aims to detect and analyze changes occurring between land use/ land cover classes in the same geographical area over time. (Guangliang et.al. 2024). Obvious changes in land use and land cover emerges as a result of both anthropogenic activities, urban expansion, infrastructural development, urban migration and government policies. CD is a technique of recognizing the dissimilarities in the images acquired at distinct intervals and are used for numerous applications, such as urban area development, disaster management, land cover object identification, etc. (Ayesha et.al 2022). Change information of the earth’s surface is becoming more and more important in monitoring the local, regional and global resources and environment. The large collection of past and present remote sensing imagery makes it possible to analyse spatiotemporal pattern of environmental elements and impact of human activities in past decades. Research has been widely reported on methodology of remote sensing change detection and monitoring. (Gong et.al. 2008). Changes in state of land object/phenomenon are the indicators of changes in land qualities, functions and use sustainability. Change Detection (CD) using satellite data is the measurement of difference between reflected/backscattered radiance from land object/phenomenon recorded in reference scene and target scene at different time. (Bhagat, 2012).
It is a fundamental task in Remote Sensing, with many real-world applications, including: urban development, agricultural surveys, land cover monitoring, disaster assessment and military. (Guangliang et.al. 2024). In recent years, deep learning (DL) techniques have been used tremendously in change detection processes, where it has achieved great success because of their practical applications. Several DL approaches such as supervised, unsupervised, and semi-supervised are used for different change detection datasets such as Synthetic Aperture Radar (SAR), multispectral, hyperspectral, Very High Resolution (VHR) imageries, and heterogeneous imageries. Change detection aims to discern both subtle and abrupt alternation in a given area as manifested through remote sensing images acquired at different times (Singh 1989).
It provides a means to study land use/cover change (Weng 2002), biodiversity (Newbold et al. 2015), the urbanization process (Han et al.2017a), disaster detection (Saito et al. 2004), and other environmental changes. Conventionally, two types of changes are often examined (Lu et al. 2004): 1) binary changes, and 2) from-to changes. The binary changes only focus on where change has been incurred or not. From-to change detection not only detects variation over time but also the specific types of change e.g. from buildings to vegetation. Lately, a new type of change has been studied: multi-class changes, i.e. clustering the detected changes into different groups regardless of the land cover types (Saha, Bovolo, and Bruzzone 2019), (Ting et.al. 2023).
Change detection is useful in many applications related to land use and land cover (LULC) changes, such as shifting cultivation and landscape changes (Imbernon, 1999, Serra et al., 2008), land degradation and desertification (Adamo and Crews-Meyer, 2006, Gao and Liu, 2010), coastal change and urban sprawl (Shalaby & Tateishi, 2007), urban landscape pattern change (Batisani and Yarnal, 2009, Dewan and Yamaguchi, 2009, Long-qian et al., 2009), deforestation (Schulz et al., 2010, Wyman and Stein, 2010), quarrying activities (Mouflis, Gitas, Iliadou, & Mitri, 2008), and landscape and habitat fragmentation and other cumulative changes (Munroe et al., 2005, Nagendra et al., 2004). This study focused on the derivation of the changes that occurred in Abuja Municipal Area Council, Abuja, Federal Capital Territory (FCT) between the land use and land cover classes over the epoch of twenty-one years, between 2002 and 2023. The present study aims to derive and assess the land surface temperature in Abuja Municipal Area Council between 2002 and 2023. The objectives of this study are:
Change Detection (CD) Abuja Municipal Area Council (AMAC) is a Local Government Area in Abuja, Federal capital Territory (FCT) in Nigeria. It is located between Latitude 8°22’54″N – 9°31’40″N and Longitude 7°30’55″E -7°34’00″E. Abuja Municipal Area Council was created on October, 1984. It is located on the eastern wing of the Federal Capital Territory and comprise of twelve wards namely, City Centre (Central Business District), Garki, Gui, Gwagwa, Gwarimpa, Jiwa, Karshi, Kabusa, Karu, Nyanya, Orozo and Wuse. The study area falls in Universal Transverse Mercator (UTM) Zone 32N. It is bound to the north by Bwari Local Government Area (LGA), to the east by Karu LGA, to the south by Kuje LGA, to the west by Gwagwalada LGA, and southwest by Nasarawa LGA in Nasarawa State. This region has an area of approximately 1586 km2. It is regarded as the Capital City and also the centre of most commercial and governmental agencies. The area contains the following districts and satellite towns; Maitama, Asokoro, Wuse, Lugbe etc. The study area is characterized by a variety of agricultural fields, residential areas, bare surface and water body.
The Köppen climate classification for Abuja features a tropical wet and dry climate. The weather conditions include a warm, humid rainy season and a blistering dry season. The period of rain starts in April and ends in October, when daytime temperatures range between 28 °C to 30 °C and the night time temperatures from 22 °C to 23 °C. During the dry season, the daytime temperatures can be as high as 40 °C and night-time temperatures can be as low as 12 °C.
The demographic survey conducted by the FCT and National Population Commission in 1993 confirms that the population of FCT was in the region of 409,000 before 1991, but rose significantly to about 700, 000 after the movement of Ministries, parastatals, departments and agencies to the capital city (National Population Commission, 1991). This resulted in overstretching the few existing facilities and influenced an increase in demand for housing, infrastructure and services which were insufficient and costly. According to Oyetunji et al., (2021). According to city population (2022), the population of AMAC as at March 2022 is 1,693,400.
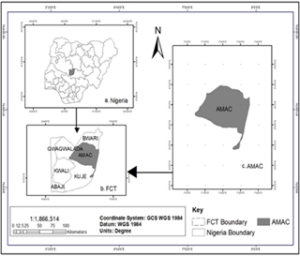
Figure 1. Abuja Municipal Area Council (AMAC), Abuja-FCT, Nigeria. Source: Author, 2024.
Remote Sensing approaches to change detection have been widely used due to its cost-effectiveness, extensibility, and temporal frequency. This study employed the use of extraction of detailed types of land-cover change based on the use of classification techniques (Chan et al. 2001; Jensen 2005).
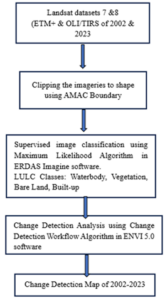
Figure 2. Methodology Workflow of the study. Source: Author 2024.
Data Acquisition and Source
The datasets used for this study were secondary data sources. They include: Landsat imageries of 2002, 2012 and 2023 and the administrative map of Nigeria which defined the boundary of the study area. The administrative map was derived from the Office of the Surveyor General of the Federation (OSGoF), Abuja-FCT, Nigeria. The Enhanced Thematic Mapper plus (ETM+) imageries of Landsat 7 were downloaded for the years; 30th of December, 2002, while the Operational Land Imager (OLI) of Landsat 8 was downloaded for 15th February, 2023. The Landsat imageries were downloaded from United States Geological Survey (USGS). http://www.earthexplorer.usgs.gov/ at the spatial resolution of 30m. The Landsat imageries were used for image classification and the results of the image classifications were used for change detection analysis.
Data Processing
Pre-processing steps for satellite images were implemented. For Landsat 7 & and 8 data, band 2, band 3, band 4 and band 5 were layer stacked and then clipped to the shape of the study area. Area.
Supervised Image Classification
Four general LULC classes including water body, built-up, bare-land and vegetation were derived in this study through pixel-based classification using the maximum likelihood algorithm in Erdas Imagine software. For each LULC class, at least 5 samples were collected and used for the classification of 2002 and 2023 imageries.
Derivation of Changes of Land Use and Land Cover Classes from Supervised Classification Results of 2002 and 2023
The classification results of were used to carry out the change detection analysis using change detection work flow algorithm in ENVI 5.0 software environment.
Land Use Land Cover Classification
The analyses and results of this work was carried out from satellite imageries, for two epochs of different years in mapping and monitoring of surface temperature in Abuja Municipal Area Council. Figures 2 and 3 present land use and land cover maps of the study area in 2002 and 2023. Tables 1 and 2 shows report of land use and land cover for different epochs, Tables 3 and 4 shows the accuracy assessment of the image classifications for the epochs and Figure 4 present change detection of the study area between for 2002 and 2023 respectively.
The land use and land cover classes were derived using the maximum likelihood algorithm to generate four classes: waterbody, vegetation, built-up and bare land using the Landsat imageries of 2002 and 2023. The maps generated from the supervised image classification are shown in Figures 2-3. Between 2002 and 2023, Built-up areas increased significantly by 968.39 km2 (61%), obviously due to expansion of residential area coupled with more anthropogenic activities over the region resulting from dynamic population growth that occurred between those years, and completion of development projects that were planned for that period. The class that contributed the most to this positive increase were bare surfaces as they lost about 511.54 km2 (−32.30%) and vegetation lost about 456.28 km2 (-28.8%) within twenty-one years. This drastic reduction was due to the increase in built-up areas. Most of the bare surfaces were replaced by the rapid development that occurred in Abuja through that period. This result agreed with Awuh et.al (2019), where between 1986 and 2001, built up areas increased significantly by 61.76 km2 (4.4%), obviously due to expansion of residential area coupled with more anthropogenic activities over the region resulting from dynamic population growth that occurred between those years, and completion of development projects that were planned for that period.
The result also agreed with Dissanayake et.al (2018), where Normalized Difference Building Index (NDBI) representing the built-up area and the spatial outline of city development in Lagos illustrated that Lagos City developed towards the northwest direction rather than the other areas, in 2002 and 2013. A large lagoon spreads close to the city midpoint in the eastern direction, and the southern portion of the city belongs to the coastal area. However, some part of the coastal area is occupied as an urban area where the harbour is located. There is a significant increase in NDBI in both time points in Lagos.
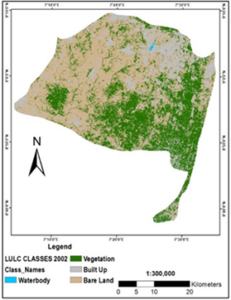
Figure 3: LULC 2002
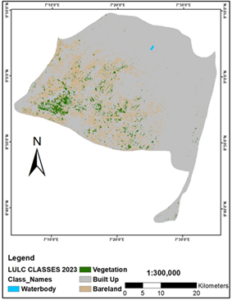
Figure 4: LULC 2023
For 2002 classification result, waterbody accounted, for 0.1% of total area, area covered by vegetation accounted 32.2 %, built up area accounted for 21.6 %, and the area covered by bare land accounted for 46.2%. For 2023 classification result, waterbody accounted, for 0.04% of total area, area covered by vegetation accounted 3.4%, built up area accounted for 82.6%, and the area covered by bare land accounted for 13.9%. The result from 2002 to 2023 shows that the built-up activities in the study area increased significantly, while the vegetation decreased significantly, followed by the bare land. This result agreed with Suzana Binti Abu Bakar et.al (2016), between 2002 to 2015, from the observation, it was concluded that there was drastic change in built-up/roads, forest. Built-Up/ roads was increased by percentage from 4.746% to 8.297% and forest was decreased from 80.927% to 78.04% respectively. Total vegetation and cultivated land from the year 2002 with 11.421% were decreased by 9.527% corresponding to the loss of 61.782 km2 to 51.537 km2 respectively. The rapid changes were detected due to tourism factor and the conversion of vegetated and cultivated land to water due to soil digging activities in Langkawi Island. The increasing rate of built-up classes both in areas and percentages as shown in tables 1,2 and 3 shows 3 shows the image classifications and the area changes in LULC classes between 2002-2023.
Table 1: 2002 Image Classification
| Value | Class | Area (hectares) | Area (Km2) | Percentage (%) |
| 1 | Built Up | 34196.94 | 341.9694 | 21.6 |
| 2 | Waterbody | 124.56 | 1.2456 | 0.1 |
| 3 | Vegetation | 51026.04 | 510.2604 | 32.2 |
| 4 | Bare Land | 73204.11 | 732.0411 | 46.2 |
Table 2: 2023 Image Classification
| Value | Class | Area (hectares) | Area (Km2) | Percentage (%) |
| 1 | Built Up | 131034.96 | 1310.3496 | 82.6 |
| 3 | Vegetation | 5397.66 | 53.9766 | 3.4 |
| 4 | Bare land | 22050.63 | 220.5063 | 13.9 |
| 5 | Waterbody | 68.4 | 0.684 | 0.04 |
Image Classification Accuracy Assessment
After the classification, an accuracy assessment was carried out by generating 149 accuracy assessment points in ArcMap environment. The confusion matrix was computed to generate the accuracy assessment report and the Kappa statistics of (0.79) and (0.56) and overall accuracy (80%) and (70%) for 2002 and 2023 respectively, as shown in tables 3 and 4.
Table 3: 2012 Image Classification Accuracy Assessment
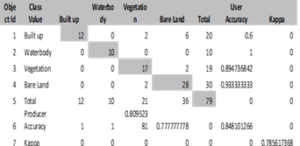
Overall Accuracy= (67/79) =0.8
Table 4: 2023 Image Classification Accuracy Assessment
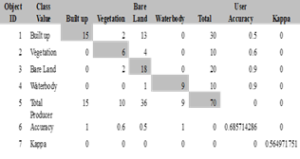
Overall Accuracy= (48/70) =0.7
Source: Author (2024).
The change detection map was derived using the change detection work flow algorithm in ENVI 5.0 software to generate the changes that occurred between the land use and land cover classes over the epochs of twenty-one years, between 2002 and 2023, as shown in figure 5.
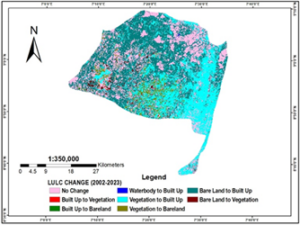
Figure 5: Change Detection of the Study Area. Source: Author (2024).
From table 5 it is shown the changed that occurred for different classes, including the calculated areas and percentages covered by the classes. It is shown that the area where no changed occurred accounted, for 27.031% of total area changes of the Land Use Land Cover classes from built up to vegetation accounted 0.05%, from built up area to bare land accounted for 0.56 %, from waterbody area to built-up area accounted for 0.03 %, from vegetation area to built-up area accounted for 28.3% , %, from vegetation area to bare land area accounted for 3.67 %, from bare land area to built-up area accounted for 38.93% and the area of change from bare land area to vegetation accounted for 1.39%. The result shows that there are lots of Land Use, Land Cover changes that occurred between these epochs, due to development, urbanization and anthropogenic activities. These results agreed with Efe et.al (2012), comparing the imageries of 1979-2007, the result shows a clear shift among residential areas, olive groves and forest terrain. It was found that the agricultural areas, particularly along the shoreline, were converted into resort houses and that the olive groves (the dominant land use) shifted from lower regions to its upper sectors. All these changes caused loss of natural habitats in the basin of karinca river, in the northwest of Turkey.
The results of this research also agreed with the findings of Dewan et.al (2009), which evaluated land use/cover changes and urban expansion in Greater Dhaka, Bangladesh, between 1975 and 2003 using satellite images and socio-economic data. “ibid”, the analysis revealed that substantial growth of built-up areas in Greater Dhaka over the study period resulted significant decrease in the area of water bodies, cultivated land, vegetation and wetlands. Urban land expansion has been largely driven by elevation, population growth and economic development. Rapid urban expansion through infilling of low-lying areas and clearing of vegetation resulted in a wide range of environmental impacts, including habitat quality.
Table 5: Change Detection
| Object Id | Value | Count | LULC Change | Percentage (%) | Area (Km2) |
| 0 | 7 | 475339 | No Change | 27.031 | 427.8051 |
| 1 | 9 | 833 | Built up-Vegetation | 0.0474 | 0.7497 |
| 2 | 10 | 9916 | Built up-Bare land | 0.5639 | 8.9244 |
| 3 | 13 | 542 | Waterbody-Built up | 0.0308 | 0.4878 |
| 5 | 19 | 498316 | Vegetation-Built up | 28.3375 | 448.4844 |
| 6 | 22 | 64509 | Vegetation-Bare land | 3.6684 | 58.0581 |
| 7 | 25 | 684606 | Bare land-Built up | 38.9312 | 616.1454 |
| 8 | 27 | 24440 | Bare land-Vegetation | 1.3898 | 21.996 |
Source: Author (2024).
This study was conducted in order to determine the land use and land cover changes (as well as the type of changes and their direction) occurring in the use of land in the Abuja Municipal Area Council, Abuja Federal Capital Territory for the period 2002-2023. The result shows that there are lots of Land Use, Land Cover changes that occurred between these epochs, due to development, urbanization and anthropogenic activities. This study shows that most land use land classes were majorly converted to built-up area due to massive urbanization, centralization of government offices and government polices of mass housing. It shows that vegetation land use/land cover class change to built-up class increased by 28.3375%, having a total area of 448.4844 km2 and bare land class change to built-up areas increased by 38.9312% with total area of 616.1454 km2 between 2002 and 2023.The total area of no change is 427.8051 km2, with the percentage of 27.031%. The changes in other classes are minimal compared to change from vegetation and bare land to built-up areas. The change that occurred from bare land to vegetation accounted for 1.3898% and covered a total area of 21.996 km2. The less significant change that occurred is the change from waterbody class to built-up class which accounted for 0.0474%, covering a total area of 0.7497 km2. Built-up expansion of the urban area is highly related to the socio-economic and industrial potentials of the study area. Enforcement of zoning regulations is required to strengthen and prevent unauthorized development, protect green spaces, and maintain ecological balance. Federal Capital Territory Administration (FCTA) should establish a spatial data infrastructure to integrate and analyze data from various sources, supporting informed decision-making. This statement is backed by the results of change detection analysis carried out in the study area. The most significant change is between vegetation to built-up classes and bare land to built-up classes as shown in the tabular results of the change.